


“Saturation” Permeability Revisited – 1
by
In 1987, Alan Johnson, now Principal Petrophysicist with Integrated Petrophysical Solutions Ltd., presented an SPWLA paper entitled “Permeability Averaged Capillary Data: A Supplement to Log Analysis in Field Studies” (SPWLA-1987-EE). This paper presented what, for the time, represented a relatively simple capillary based saturation height model of the form:
![]()
This relationship, derived at a time before spreadsheet analysis had developed to its current level, was designed to be solved in a step-wise fashion using the linear regression functionality then available on programmable calculators.
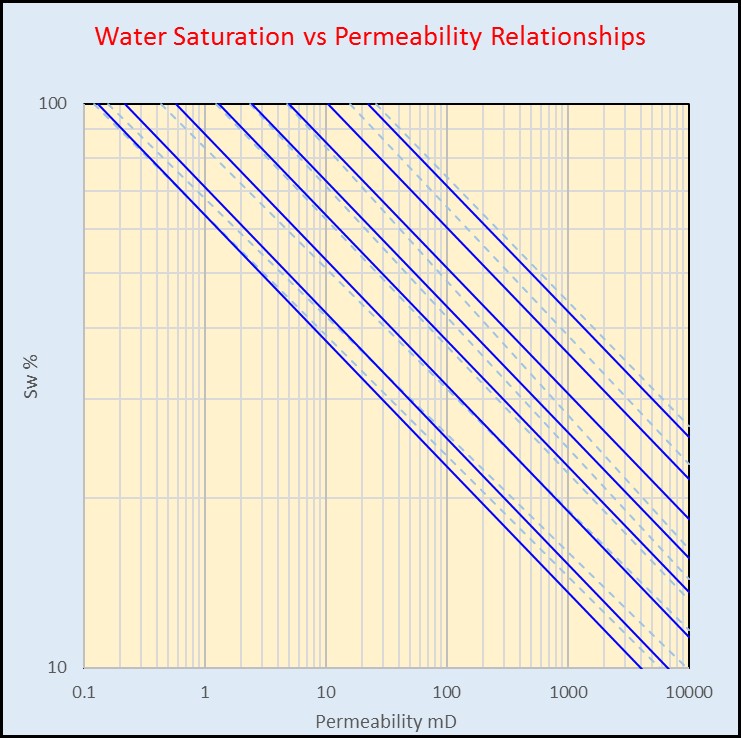
The basis of the relationship was the recognition of near-linear relationship on a bi-logarithmic plot of water saturation versus permeability at a single value of capillary pressure (Pc) or its equivalent height above free water level (FWL), yielding a relationship of the form:
![]()
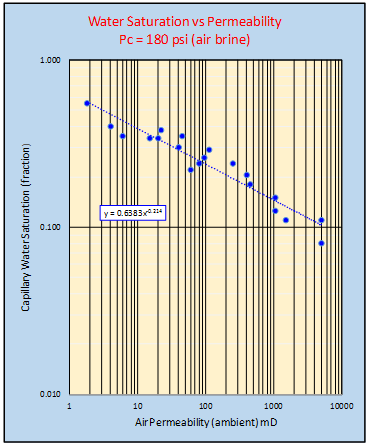
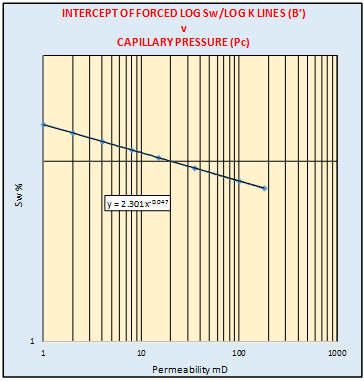
The step wise approach involved calculating the regression lines for each discrete capillary pressure in the data set. With the observation that all these lines tended to be reasonably parallel, the slopes (E) of the lines were averaged to give slope (E’) and the intercepts (D) recomputed to give values od D’ for each capillary pressure set. Regression of a second bi-logarithmic plot of D versus Pc, yielded a relationship of the form: ![]()
Combining (2) and (3) gives a relationship of the form given in (1)
![]()
Where Pc can be converted to height by a simple multiplier.
This derivation process is rather cumbersome but was largely dictated by the limitations of the interactive computing capacity available at the time. Nowadays the same derivation could be carried out in a single step by applying a routine like SOLVER in EXCEL to the entire data set, setting the goal to minimise, for example, the error between measured and modelled Sw.
In retrospect, a further shortcoming of the approach was the rather cumbersome form of the relationship when expressed in terms of Sw:
![]()
The paper goes on to describe various applications of the derived relationship including:
- The estimation of original formation saturation and thus the identification of swept zones, post water-flood, by comparing with current log-derived values.
- The estimation of permeability as a function of log-derived saturation and height.
- The deviation of zone average “saturation permeabilities” computed from zonal averages of log derived saturations. These would be used in volumetric analysis by mapping the values between wells. The resulting saturation permeability grid was then used, in conjunction with zone height, to construct water saturation grids and maps which honoured the values derived at the wells, while accounting for rock quality and height variations across the field.
- An attempt to back-calculate free water level depth from log saturation and permeability data (this being the least successful application)
In 1999 P. Mitchell, D. Walder and A.M. Brown of BP published a short paper in the Society of Core Analysts entitled “Prediction of Formation Water Saturation from Routine Core Data Populations” (SCA-9955). In this paper, they proposed a saturation/height/permeability relationship of a similar but rather simpler form:
![]()
This relationship gives recognition to the fact that individual plots of water saturation versus capillary pressure also show an approximately linear relationship on a bi-logarithmic plot.
This type of relationship already recognised in the so-called “lambda” model: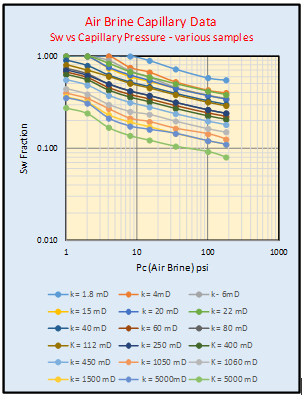
![]()
In the future editions of this blog we will be comparing how the two methods perform in practice and what light the newer relationship may shed on the “saturation permeability” approach.